The ap stats formula sheet is one of the most valuable resources for students preparing for the AP Statistics exam. Whether you are reviewing probability rules, sampling distributions, confidence intervals, or hypothesis testing, knowing how to use the formula sheet can save time and improve your score. Instead of trying to memorize every equation, students should focus on understanding when and why each formula is used.
In this guide, we will break down the key sections, and provide tips to help you succeed on exam day.
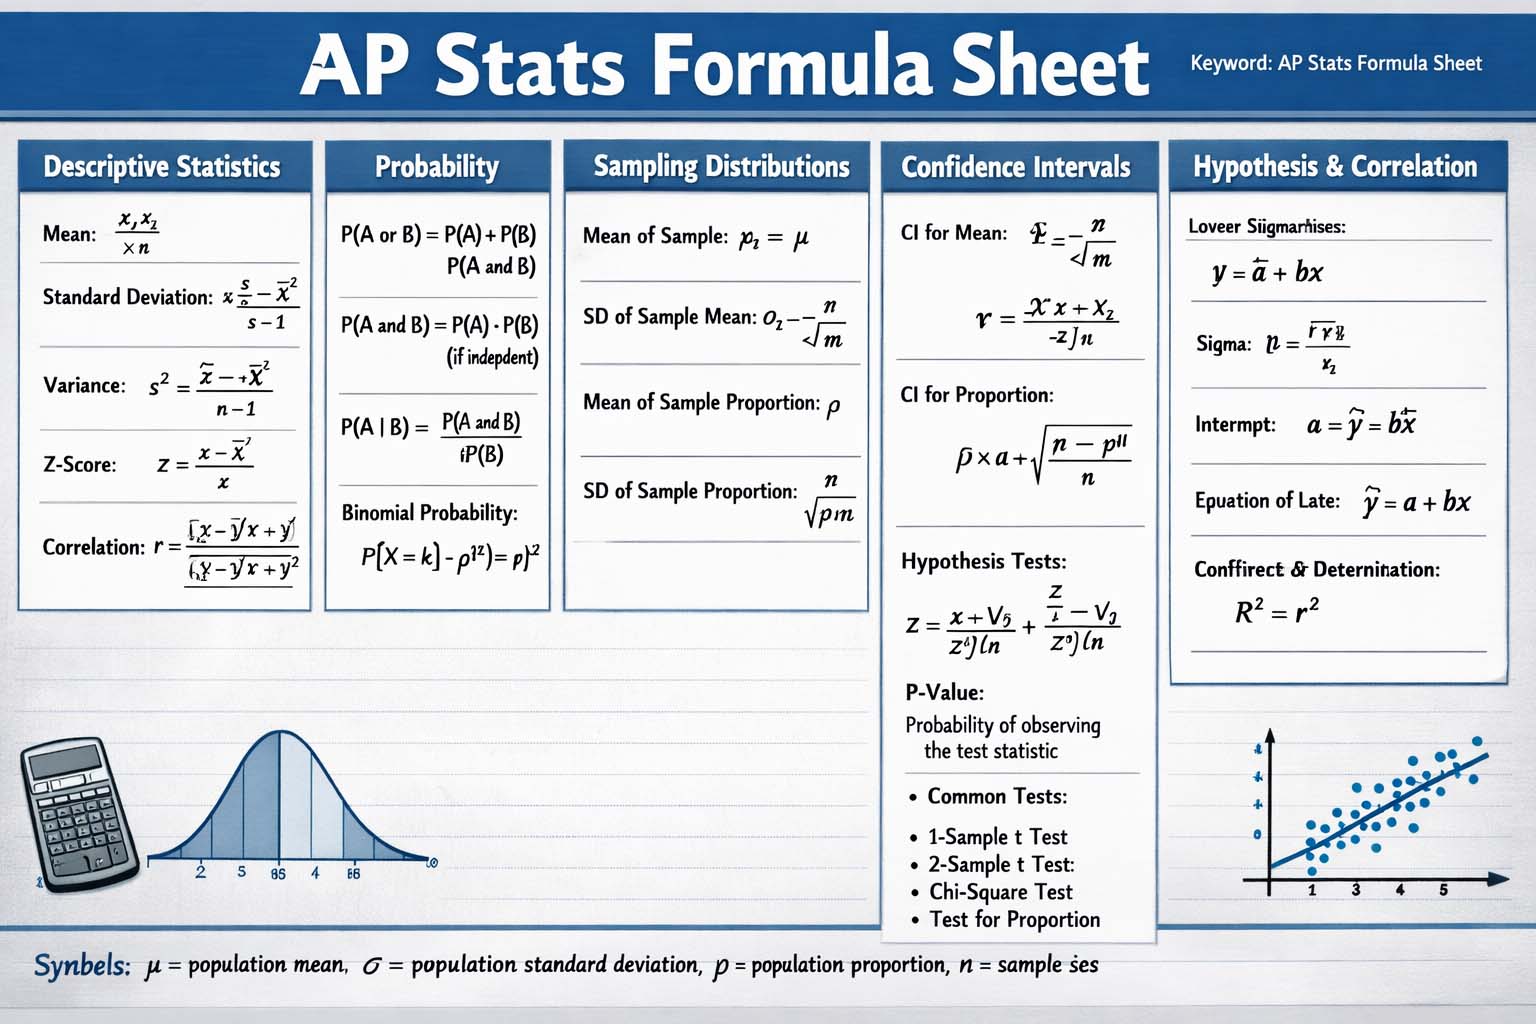
What Is the AP Stats Formula Sheet?
The ap stats formula sheet is an official reference page provided during the AP Statistics exam. It contains formulas and statistical tables that students may need while solving multiple-choice and free-response questions. This sheet helps reduce the need for memorization and allows students to concentrate on interpretation and problem-solving.
The formula sheet usually includes:
- Descriptive statistics formulas
- Probability rules
- Sampling distribution equations
- Confidence interval formulas
- Hypothesis test formulas
- Regression and correlation formulas
- Chi-square test formulas
Understanding how to navigate this sheet quickly is essential for success.
Why the AP Stats Formula Sheet Matters
Many students assume the formula sheet will automatically make the exam easier. how to use it efficiently. If you waste time searching for equations, it can slow you down.
The ap stats formula sheet 2026 is expected to follow the same structure as previous versions, with formulas covering core AP Statistics topics. While updates can happen, the main concepts remain consistent. Students should always review the latest official version before the exam.
Main Sections of the Formula Sheet
1. Descriptive Statistics
This section includes formulas for mean, standard deviation, and variance. These are useful when summarizing data sets.
Common formulas include:
- Mean of a sample
- Standard deviation of a sample
- Z-score calculations
These formulas help compare values and measure spread.
2. Probability
Probability is heavily tested in AP Statistics. The sheet often includes:
- Addition rule
- Multiplication rule
- Complement rule
- Conditional probability concepts
Knowing when events are independent or mutually exclusive is key.
3. Sampling Distributions
Sampling distributions are important because they explain how sample statistics behave over repeated samples.
This section includes formulas for:
- Mean of sampling distributions
- Standard deviation of sample means
- Standard error calculations
Students often use these formulas when constructing confidence intervals or performing hypothesis tests.
How to Use the Formula Sheet Efficiently
The formula sheet ap stats exam takers receive is most helpful when students practice with it beforehand. Here are some strategies:
Memorize Locations
You do not need to memorize every formula, but you should know where each category appears. This helps you find equations faster during the exam.
Understand Variables
Know what symbols mean, such as:
- μ = population mean
- x̄ = sample mean
- p̂ = sample proportion
- σ = population standard deviation
Recognizing symbols prevents confusion.
Practice with Real Problems
Use past AP Statistics questions and solve them while referencing the formula sheet. This builds speed and confidence.
Confidence Intervals and Hypothesis Testing
focuses on inference. The formula sheet provides equations for:
- One-sample z-interval for proportions
- One-sample t-interval for means
- Two-sample intervals
- Test statistics for hypotheses
Students should know the conditions required before using each formula, such as random sampling and normality assumptions.
Regression and Correlation Formulas
Regression helps model relationships between variables. The formula sheet often includes:
- Least squares regression line
- Correlation coefficient notation
- Residual definitions
Remember that correlation does not imply causation, which is a common concept tested on the exam.
Chi-Square Tests
Chi-square procedures are also included in AP Statistics. These tests compare observed counts to expected counts.
Examples include:
- Goodness-of-fit tests
- Test for homogeneity
- Test for independence
Students should also know degrees of freedom and conditions for expected counts.
Best Study Tips for AP Statistics
Using the stats ap formula sheet wisely requires strong preparation. Here are top study tips:
Review Concepts Daily
Spend time reviewing vocabulary such as bias, variability, significance level, and confidence level.
Use Flashcards
Make flashcards for symbols, formulas, and test conditions.
Take Practice Exams
Simulate exam timing and use the formula sheet
Focus on Interpretation
Many AP Statistics questions ask you to explain results in words, not just calculate answers.
Common Mistakes Students Make
Avoid these common errors:
- Using the wrong formula for proportions vs means
- Ignoring assumptions and conditions
- Misreading calculator outputs
- Confusing sample statistics with population parameters
- Spending too much time searching the sheet
Practicing ahead of time can help eliminate these mistakes.
Is the Formula Sheet Enough to Pass?
The formula sheet is helpful, but it is not a substitute for understanding the course material. Students who know concepts, practice calculations, and interpret results clearly are more likely to earn a high score.
Think of the formula sheet as a tool—not a shortcut.
Final Thoughts
The ap stats formula sheet is one of the best resources available during the AP Statistics exam. It provides formulas for probability, inference, regression, and descriptive statistics, allowing students to focus on reasoning instead of memorization. By practicing with the sheet ahead of time and learning where formulas are located, you can improve both speed and accuracy.
Whether you are using the ap stats formula sheet 2026, reviewing the formula sheet ap stats, or studying with a stats ap formula sheet, the key to success is preparation. Master the concepts, practice regularly, and use the sheet strategically on exam day.